New Look! With One Catch!

As you can probably tell, we have a new look. I changed the site from using Google’s Blogger platform to WordPress, which gives me more options as the blogger to post and share. While I’m excited about everything I can do with the new site, there is a catch for the reader.

If you previously subscribed to my Blogger site, you will need to re-subscribe to this one. As a reminder, this is what my old site looked like:

2016-05-16_1214

And this is what my new site looks like:

2016-05-16_1215.png

So how do you subscribe to my site? It’s very easy! In the top right corner, you will see a header “Subscribe Via Email.” Enter your email address in the box, click “Subscribe” and then check your email for a confirmation link.

SubscribeViaEmail

Once you click that link, you will get all of the Lowry-Witt genealogy goodness right to your inbox!

The Tree of Life wasn’t your family tree

What a lot of people don’t realize is that Noah built the ark not for animals, but for saving early census records and birth certificates. Do you have any idea what flood waters do to genealogical records?

I found this comment on the Irish Genealogy Facebook page and couldn’t help but chuckle. If only tracing your family history back a few thousands years accurately was that easy (or possible!).

My Genealogy Database in 2015

I maintain all of my genealogical information using a software application called Family Tree Maker. Here’s the current snapshot of my database:

People: 2,335
Marriages: 658
Places: 768
Media: 2559 (photographs and document images)

Repositories: 14
Source Groups: 268
Source Citations: 4313

4,313 citations equals 1.85 citations per person, just shy of two. As many ancestors have many more citations, it’s safe to say that there are people in my family tree for whom I have no proof. Hopefully over the next year I can get that number much higher.

By documenting this information at the start of the year, I hope to be able to track the growth of my family tree year to year. Since this is the first time I’ve done this, I have nothing to compare, but next year should prove interesting.

Happy New Year!

My DNA Says I Am From Where?!

DNA tests can reveal new ancestors, show your ethnic breakdown and solve genealogical mysteries that would otherwise go unanswered. A problem arises when the same genetic material gives you two different answers to one question:
Where Am I From?
Trying to figure you where you came from historically and genetically is much simpler than it was a decade ago. Several companies offer DNA tests that include ethnicity estimates. These estimates are created by analyzing your genetic material (just a small amount of saliva) and comparing it to thousands of others. While realizing they are only estimates, they provide a little more truth to statements such as, “I’m 50% Irish, 30% German and 20% English,” or whatever you’ve always believed your ethnic breakdown to be. Keeping in mind that these are estimates and that Europe is as much of a melting pot as America can lead to some interesting statistics.
I wrote about a DNA test that my father took a few months ago through Family Tree DNA. I recently took a DNA test of my own through AncestryDNA, another company that offers tests as part of their genealogical product offering (the parent is Ancestry.com). Included in my results was the ethnicity estimate. AncestryDNA writes that they calculate their ethnicity estimates this way:

We create estimates for your genetic ethnicity by comparing your DNA to the DNA of other people who are native to a region. The AncestryDNA reference panel (version 2.0) contains 3,000 DNA samples from people in 26 global regions. 

We build the reference panel from a larger reference collection of 4,245 DNA samples collected from people whose genealogy suggests they are native to one region. The images below show the process of gathering local samples from various parts of the world. 

Each panel member’s genealogy is documented so we can be confident that their family is representative of people with a long history (hundreds of years) in that region.
Each volunteer’s DNA sample from a given region is then tested and compared to all others to construct the AncestryDNA reference panel. In the end, 3,000 of 4,245 individuals are chosen for the AncestryDNA reference panel (version 2.0). These individuals make up 26 global regions.

We then compare your DNA to the DNA in the reference panel to see which regions your DNA is most like. The ethnicity estimate you see on the web site is the result of this comparison. When we calculate your estimate for each ethnicity region, we run forty separate analyses. Each of the forty analyses gives an independent estimate of your ethnicity, and each one is done with randomly selected portions of your DNA. Your genetic ethnicity estimates and likely ranges for these estimates come from these forty analyses.[1]

With all of that in mind, I was excited to see my breakdown and learn if it matched my research. That research would indicate that I’m at last 60% German, 25% Irish, and 15% English. Keep in mind this is only going back 5 generations on average; going back any further is rather complicated because of the number of grandparents and the gaps in research. Much to my surprise, it was nowhere close!
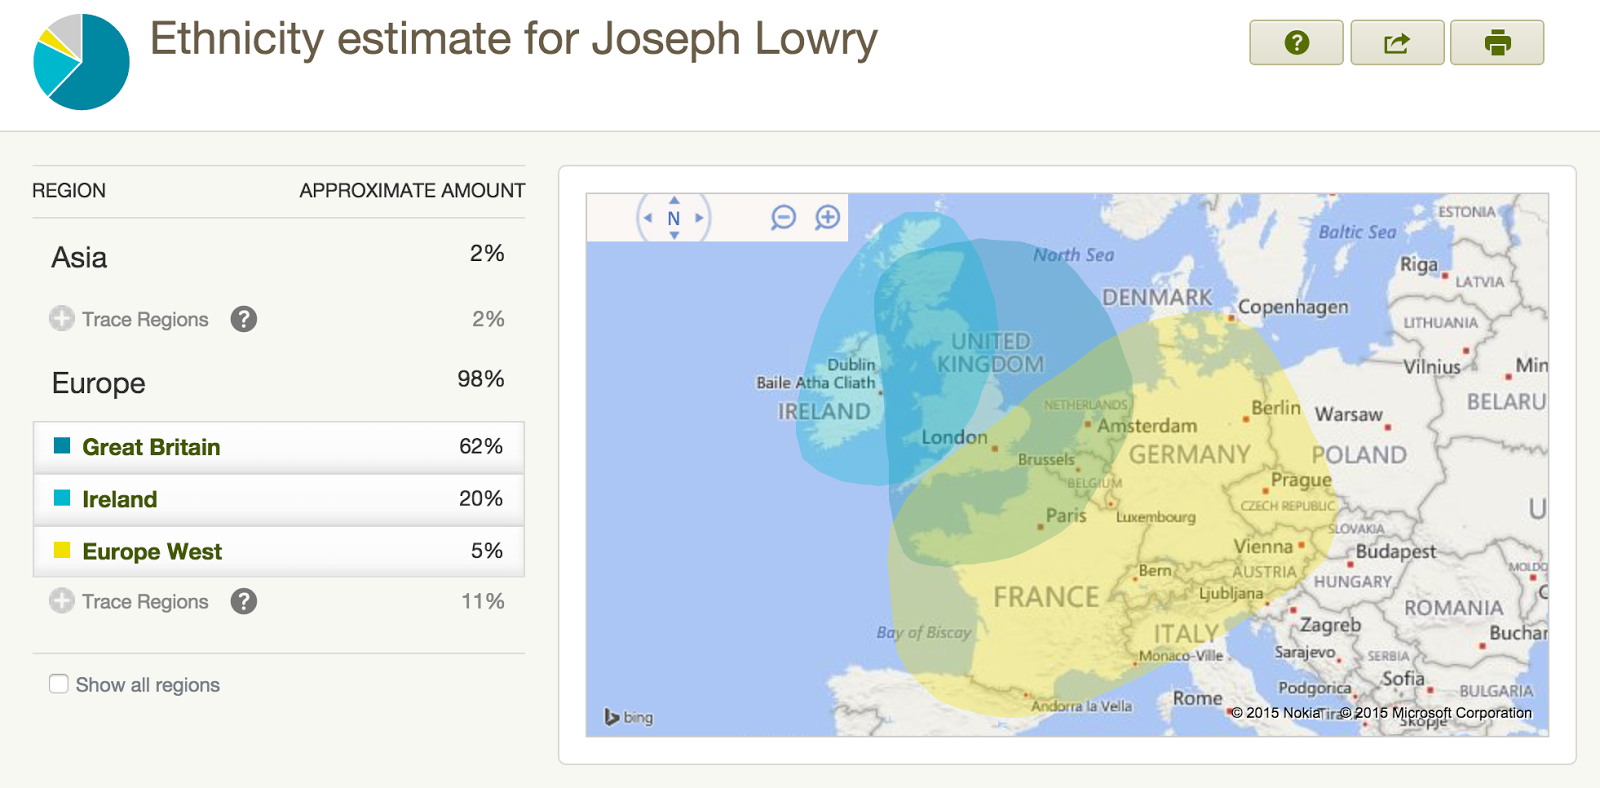
My AncestryDNA estimate indicates that I am 62% descended from Great Britain, 20% Ireland and only 5% from Western Europe. WHAT?! Where are my Germans?! I have German surnames including Bahle, Witt, Bixler, Governor, Porubsky, Schulmeister, and Pepperney (Anglicized in a few cases) in my family history and they are getting almost no recognition by my saliva!
My ethnic matches from AncestryDNA’s autosomal DNA test. (click to enlarge.)
I was a bit stunned by the results but realize that over centuries people move. These results aren’t meant to capture a single moment in time but ancestral makeups throughout history.
Once I had my AncestryDNA results, I actually transferred my raw DNA data to Family Tree DNA. They have a service that takes the raw data from another company and uses their algorithms to produce an ethnicity report. After only a few days (since they only had to analyze the data and not test saliva), I had my results based on their algorithm.
According to Family Tree DNA, they calculate their estimates based on the following, in part, and with a bit more science in the explanation:

We assembled a large number of candidate reference populations which were relatively unadmixed and sampled widely in terms of geography. From these we removed related or outlier individuals with the Plink software, utilizing identity-by-descent (IBD) analysis and visually inspecting multi-dimensional scaling plots (MDS). Further visualization established that the reference population sets were indeed genetically distinct from each other. We also ran Admixture and MDS with specific populations to asses if any individuals were outliers or exhibited notable gene flow from other reference groups, removing these. Admixture was run on an inter and intra-continental scale to establish a plausible number of K values utilizing the cross-validation method [Alexander2011]. After removing markers which were missing in more than 5 percent of loci and those with minor allele frequencies below 1 percent, the total intersection of SNPs across the pooled data set was 290,874. The final number of individuals in was 1,353. 

To validate our Reference Population set we tested them against a list of well studied benchmark groups whose ancestral background in the literature has been well attested. Additionally we also cross-checked against individuals with attested provenance within the GeneByGene DNA database.[2]

So both companies test their results against certain population groups who they believe have remained relatively static over time. Still, once I checked my result, I was again surprised and this time for entirely different reasons.

My ethnic makeup according to Family Tree DNA. (click to enlarge.)
My Family Tree DNA estimate indicates I am 42% British Isles (Great Britain and Ireland), 30% Scandanavian, and 26% from Southern Europe. A mere 2% Central Asian is a statistical anomaly that I discount. So what does this imply? It’s certainly very different from my AncestryDNA results. It too fails to properly represent my presumed Germanic background. Neither result indicates anything close to the percentages I had assumed based on my research.
This raises so many more questions than it answered. It is forcing me to dig deeper and cast a wider net than I previously imagined in search of the truth of where I come from. I also realize these are simply estimates based on a small bit of saliva. If the tests were run again, the results could be slightly different. Genetic genealogy is a new field for me, and one that I am eager to continue exploring. I plan to share more of these discoveries in future posts!

Sources:
Ball, Catherine A., Mathew J. Barber, Jake K. Byrnes, Josh Calloway, Kenneth G. Chahine, Ross E. Curtis, Kenneth Freestone, Julie M. Granka, Natalie M. Myres, Keith Noto, Yong Wang, and Scott R. Woodward. “Ethnicity Estimate White Paper.” Ancestry.com (2013): n. pag. 30 Oct. 2013. Web. 17 Feb. 2015.

Khan, Razib, and Rui H. “MyOrigins Methodology Whitepaper – FTDNA Learning Center.” FTDNA Learning Center. Family Treee DNA, 8 May 2014. Web. 17 Feb. 2015.

What’s My Ancestor Score?

If you scored 14% on a test, most people would consider that a failure. I see it as showing room for improvement. I recently tried to determine my ‘ancestor score’ and it turned out to be 14%. An ancestor score is the percentage of ancestors in 10 generations that I have identified.

Last Saturday, Randy Seaver of the Genea-Musings blog asked his readers to determine their ancestor score so I played along. In 10 generations, a person will have 1,022 direct ancestors. This starts with your parents and walks through grandparents, great grandparents, etc. Once you add yourself, you have 1,023 people.

I had no problem counting the people in my family tree through the 6th generation, but after that, it becomes difficult to count everyone. After all, a person has 64 4x great grandparents. To ease the burden, I created what is called an Ahnentafel Report. An Ahnentafel Report can be created in most genealogy software programs and places all of the direct ancestors of a particular person (in this case me) in numeric order. It becomes very easy to determine how many ancestors of each generation you have.

You can see my results below. Overall, I don’t consider my score to be horrendous as I have 100% of my ancestors identified through 6 generations and 75% identified through 7 generations. For most people, the 7th generation leads back to the early 1800’s. So I don’t consider this to be a poor score; it just means that I have much more research to do!

Click to enlarge.

Top 5 Posts of 2014

2014 was a great year for my genealogy research. I made some fantastic discoveries, both personally and professionally, that will continue to enhance my search for ancestors. This website has been a great resource to help me connect with newly-located cousins and share facts and stories with known relatives. The past year saw the creation of a custom URL – http://www.lowrygenealogy.com – and almost 70 posts to share information and photos. Thanks to all of you who enjoy what I put together, whether it is by visiting the site or subscribing to the e-mail digest. As I look back, thanks to some Google stat magic, these were the top five posts of 2014…

5. New URL, Same Great Content – The blog has a new home and I am so happy to share it.

4. Treasure Chest Thursday – Pennsylvania Death Certificates, 1906 – 1924 – You have no idea how hard it is to prove someone is dead. Until you have their death certificate, that is.

3. (Not So) Wordless Wednesday – A look at the new baby Lowry! – A little genealogy trickery…

2. Military Monday – The Crew of the ‘Rum Pot II’ – A very cool crew photo of a World War II bomber.

and last but not least…
*Drumroll, Please!*
1. Those Places Thursday – A Geography of the North Side – The most popular item on the blog in 2014 is not even something I wrote. My uncle Chuck Lowry wrote up a few stories of life on Youngstown’s North Side; they are shared here with permission.

How Being a New Parent Can Change One’s Genealogy Habits

A few days after his birth, I wrote a new blog post about my son Brendan and shared a few photos of the little guy. It was exciting to be able to add a new twig to the family tree, quite literally. I was almost giddy adding Brendan to my Ancestry.com online tree. What I didn’t expect were the very significant changes to my genealogy habits that would result from this little bundle of joy.

Genealogy is a hobby that I have poured hours upon days into over the last several years. I have attempted to be as professional as an amateur genealogist can and that takes time. Before Brendan was born that may have meant hours working in front of the computer. It was not unusual for me to get home from work at 6:30 p.m., have dinner and then spend the next two or three hours searching for documents, following leads, and working my way down genealogical rabbit holes. I would easily lose myself in Ancestry.com or Familysearch.org and before long, it’s 11:30 p.m. and I’ve guaranteed myself only four or five hours of sleep.

As anyone with a toddler knows time is not something I have in abundance anymore. Brendan’s presence has forced a shift in my genealogy habits. Parenting requires that my genealogy involve more fits and starts. I’ve had to become an expert at “5-minute genealogy.” Thanks to the Ancestry.com app, maybe I conduct a quick search for a record on my iPad or clean up my family tree on my iPhone. It’s not unusual for me to conduct a records search, walk away from the computer and come back an hour later not remembering what I had already looked at. Instead of trying to figure it out, I tend to open a new browser tab and start a new search. Pretty soon I have 15 tabs open in Google Chrome, all with search results or record displays and not much to answer for it.

Besides cleaning the house, doing laundry and maybe (just maybe) watching TV, I can usually work on my genealogy for an hour or so after Brendan goes to bed. I tend to rotate between conducting research and new blog posts. Because a blog post of any substance can take at least an hour to write and source, they are often now done haltingly. (I started writing this one over two months ago.) Hence, you will see a lot of “(Not So) Wordless Wednesday” posts, with just a photo and a caption and a lot fewer detailed articles.

While cranking out the work may be harder, I do have a new emotional driver for my work. Brendan is obviously a descendant to whom I can pass my work. I have no idea if he will ever appreciate genealogy, but there are family stories and photos that I want him to hear and see. As we all know, it’s important to pass down the stories of the ancestors he didn’t know as I did, like my grandfather Chuck Lowry or great grandfather Francis Witt. Genealogy has become more meaningful as I write down my family history for him.

Having Brendan in my life is a blessing. With the exception of wanting an hour or two of additional sleep each night, I wouldn’t change a thing. This includes cutting back on the genealogy. Instead of 20 hours a week spent with dead relatives, I gladly spend more time with the living. And those are the real memories I want to remember.

We interrupt this broadcast…

I’ve been pretty lax posting to the blog lately, and actually I haven’t done much genealogy at all of late. Aside from participating in one webinar and reading a few genealogy articles, I’ve done little to further my own research in the last month. While I have a four month old at home, the current cause of my near abandonment of this hobby is work. My boss recently moved on and a replacement hasn’t been named, so for the last three months I’ve been doing two jobs and will for the foreseeable future.

While I didn’t used to sit at work all day and do genealogy, I did use downtime in the office to sketch out blog posts and ideas for research. I have nearly zero downtime now so it’s a lot harder than it used to be. I love this blog and genealogy in general, so I will certainly find a way to carve out some time to post some new family tidbits. Just don’t be surprised if you don’t see them as often as you used to.

Another Branch To My Family Tree

You haven’t seen much from the blog this month, but that’s because the Lowry family has been super busy taking care of its newest member. Brendan Francis Lowry was born to Eileen and I on April 16 at 10:55 p.m. at Inova Loudoun Hospital in Ashburn, Virginia. He tipped the scales at 9lbs, 5 oz. and was 21 inches long. Both mom and baby are fantastically healthy. Brendan is even just two ounces shy of his birth weight after just 10 days. He’s going to be quite the bruiser!
Many people have asked Eileen and I how we chose his name, a STRONG Irish one at that. It was not an easy process. Most people know that we weren’t certain whether we were having a boy or a girl. It made things twice as hard as we needed to come up with both boy and girl names. We both were partial to Irish names but looked online and in name books for some time before we settled on our choices. Frankly, we just liked the way Brendan sounded. Once we started saying it, “Brendan Lowry… Brendan Lowry…,” we really liked it. Our girls name is still a secret to most; it’s being reserved for a future daughter. As for his middle name, Francis is a family name. It was Eileen’s father’s middle name and a name shared by my great grandfather Francis Witt and his son, my great uncle.
Except when he’s hungry, Brendan is the most content, chill child I’ve ever seen. He loves to be held and rocked, enjoys a good nap (as evidenced by most of these photos) and has what I assume to be a deep appreciation for Bruce Springsteen. Everyday is a new adventure. Thanks to everyone for their well wishes and thoughts. We couldn’t be more in love with this child.


I hope to resume to my normal blogging schedule in the coming weeks. First I need to catch up on sleep…